


Alex Peats-Bond
CTO, Co-founder @ Senpilot
Executive Summary (tl;dr)
- Machine Learning can extend the wear-out period of an asset
- The average utility has $30B in capital assets; reducing volatility is worth $3B to the average utility
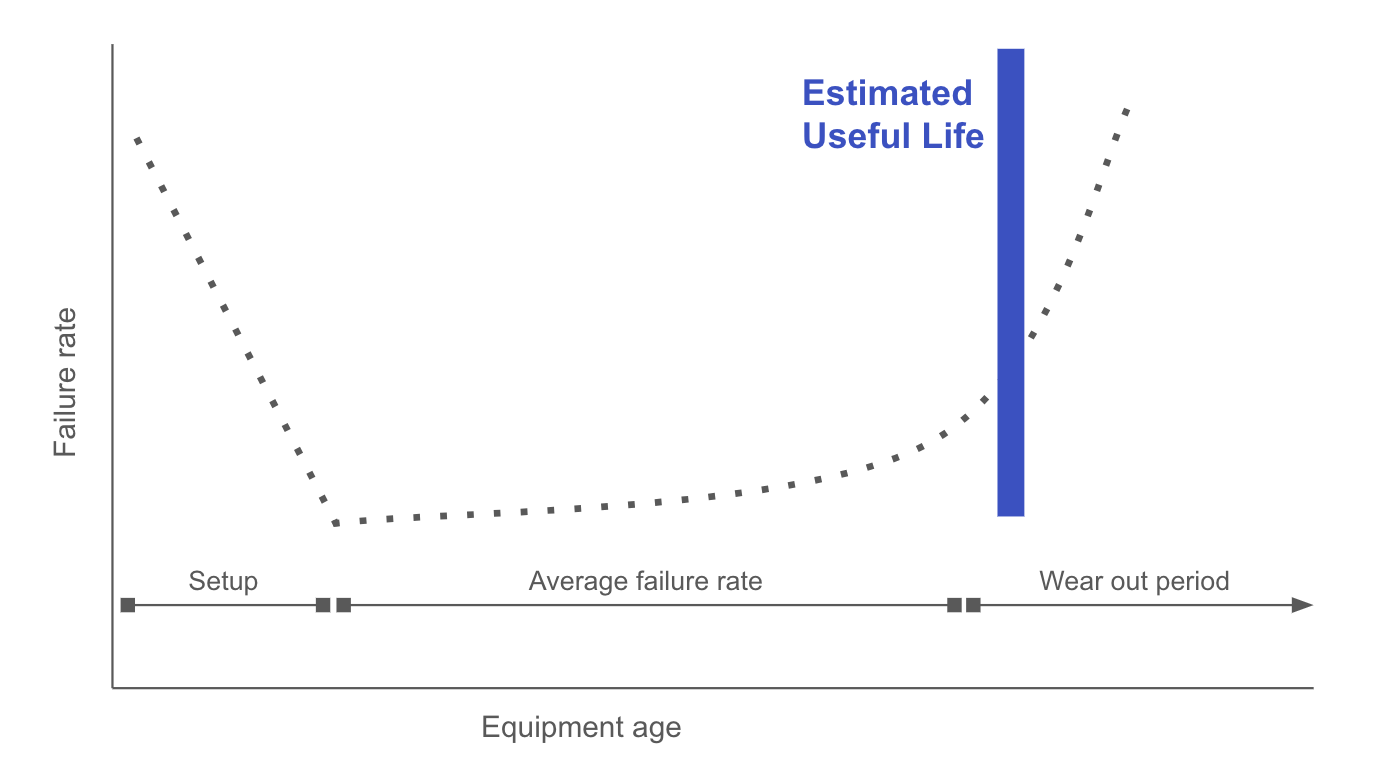
The "wear out period" in the Asset Management Lifecycle
In the US and Canada, Utilities today are running ~15% of assets past expected life. The life of a hard asset has high variability - as discussed in another article we published. This means the goal should be to maintain assets in such great lengths as to see this percentage increase. However, the natural problem that occurs is best understood through the failure curve (below). Operators, regulators, the public can all become anxious as assets age. The wear-out period is classified by higher failure rates, and therefore more volatility. With each passing year, the the risk increases exponentially.
How machine learning at scale can tackle the wear-out period
Machine learning can let utilities enhance asset reliability, minimize downtime, and optimize maintenance schedules. But how?
Senpilot's AI-driven predictive analytics capabilities enable utilities to detect intricate fault patterns that evade human detection, facilitating early intervention and risk mitigation. Reducing volatility leads to higher confidence to push longer asset lifecycles.
The goal of a concrete ML system, or any advanced model, should be to learn as much as possible. The larger the scale of learning, the better the pattern recognition becomes. Sounds easy? Not at all. To have a functional model at one utility is not enough. Think of how ML can dominate chess, and where it still (rarely) loses to humans. When the model recognizes a pattern, it uses statistics to predict the outcome and optimize accordingly. When the model runs for the first time, it is bad at chess. Every move catches the model off-guard as it is a new move (a new pattern). But eventually, the next similar failure is better predicted. To translate this to ML for utilities, think about generic Utility X and Utility Y. When Utility X has a failure, the model learning at Utility X is able to pickup the pattern and better forewarn in the future. But Utility Y has its own model, and the models do not communicate. When the same pattern emerges at Utility Y, the Y model has never seen the failure before, and does not predict any risk. Wouldn't it be great if the failure at Utility X was able to stop the failure at Utility Y? Machine learning at scale is the solution to high enough confidence to push the wear-out period further than ever before.
What we're working on at Senpilot
Our team is working on the largest scale models, specific to utilities. Senpilot's vision it to remove risk from grids. Our engineering team has built, and continues to upgrade, two distinct modules. One module is what we call the Data Ingestor (the "DIG"). In a nutshell, Senpilot DIG is able to centralize data into multiple useful structures, ready for standardization into relationships that can be translated across utilities. This is incredibly important to the idea above - learning at the highest scale. Dig it? We do.
The second module encompasses the Pilot Center. This is where all the inference is relayed into insightful tools. We avoid showing data as much as possible, because we understand the value comes from insights and not data. The Pilot Center is the surface level interaction that utilities have with Senpilot. Underneath, the module is powered by many advanced, and constantly learning, models. This part is more useful to the risk scoring than the asset management piece described in this article, but it's all connective tissue.
.svg)


.svg)